Fig. 2
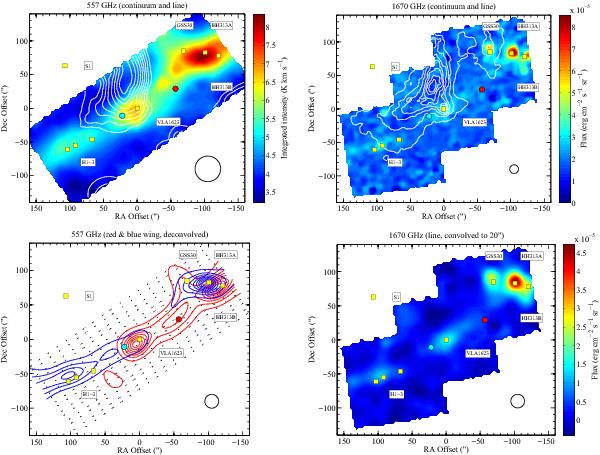
Upper left panel: colour map shows the integrated intensity over the H2O (110 − 101) line from − 40 to +55 km s-1. Contours show the level of the 557 GHz continuum in steps of 14 mK where the first contour is at 79 mK. The HPBW is 38′′. Upper right panel: the colour map shows the flux of the H2O (212 − 101) line. Contours show the continuum level in steps of 4 × 10⁻⁴ erg cm-2 s-1 μm-1 sr-1 where the first contour is at 4 × 10⁻⁴ erg cm-2 s-1 μm-1 sr-1. The HPBW is 13′′. Lower left panel: the blue and red contours show the integrated H2O (110 − 101) intensities in the blue and red wings for the de-convolved map. Red contours are in steps of 0.85 K km s-1 and the first contour is at 0.16 K km s-1. Blue contours are in steps of 1.14 K km s-1 and the first contour is at 0.16 K km s-1. The readout positions for the OTF map are indicated with black dots. The horizontal and vertical polarisations are separated by 6′′ in the north-east to south-west direction. Lower right panel: the colour map shows the integrated intensity for the H2O (212 − 101) map convolved to 20′′ resolution. In all panels, the peak positions of the CO (2 − 1) emission are indicated with blue (B1) and red (R2) dots. The star S 1, the young stellar object GSS 30 and other HH objects and near-infrared knots are indicated with labels and yellow squares. The beam sizes (or equivalent resolution for modified maps) are indicated with black circles in the lower right corners of each figure.
Current usage metrics show cumulative count of Article Views (full-text article views including HTML views, PDF and ePub downloads, according to the available data) and Abstracts Views on Vision4Press platform.
Data correspond to usage on the plateform after 2015. The current usage metrics is available 48-96 hours after online publication and is updated daily on week days.
Initial download of the metrics may take a while.