Fig. 13
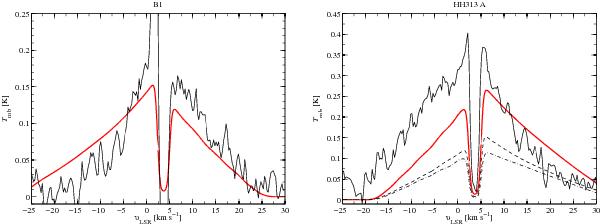
Left panel: observed 557 GHz spectrum (solid black line) at the B1 position compared to the spectrum computed with the Monte Carlo code (solid red line) where X(H2O) = 6 × 10⁻⁸. Note that the narrow emission component is not included in the model. Right panel: the observed spectrum (black solid line) at the HH 313 A position compared to the computed spectrum (red solid line). The model has two components, an extended component (dashed line) and a small hot component (dashed-dotted line). Note that blue-shifted emission, originating from GSS 30, is visible in the observed line profile.
Current usage metrics show cumulative count of Article Views (full-text article views including HTML views, PDF and ePub downloads, according to the available data) and Abstracts Views on Vision4Press platform.
Data correspond to usage on the plateform after 2015. The current usage metrics is available 48-96 hours after online publication and is updated daily on week days.
Initial download of the metrics may take a while.