Free Access
Fig. 11
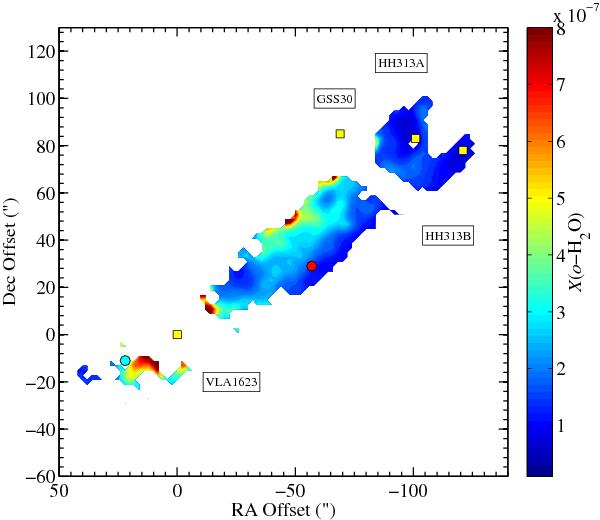
Colour-scale shows the o-H2O abundance variation with respect to H2 in the north-western part of the flow (see Sect. 4.1 and Fig. 7). The positions of R2, B1, VLA 1623, GSS30, HH 313 A and HH 313 B are indicated with coloured dots.
Current usage metrics show cumulative count of Article Views (full-text article views including HTML views, PDF and ePub downloads, according to the available data) and Abstracts Views on Vision4Press platform.
Data correspond to usage on the plateform after 2015. The current usage metrics is available 48-96 hours after online publication and is updated daily on week days.
Initial download of the metrics may take a while.