Fig. 10
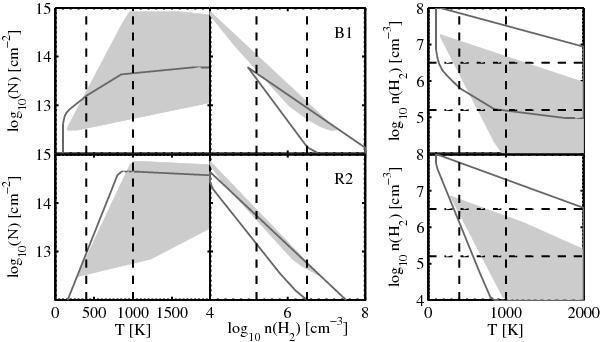
N(H2O), n(H2) and T, that are in agreement with the observed values within the uncertainties. The upper panels are for B1 and the lower panels for R2. The filled areas are for the ortho-lines and the regions indicated with a solid line are for the para-lines. The temperature for the warm and hot component and the density range inferred from the [O i] 63 μm to [O i] 145 μm ratio (Liseau & Justtanont 2009) are indicated with dashed lines.
Current usage metrics show cumulative count of Article Views (full-text article views including HTML views, PDF and ePub downloads, according to the available data) and Abstracts Views on Vision4Press platform.
Data correspond to usage on the plateform after 2015. The current usage metrics is available 48-96 hours after online publication and is updated daily on week days.
Initial download of the metrics may take a while.