Fig. 1
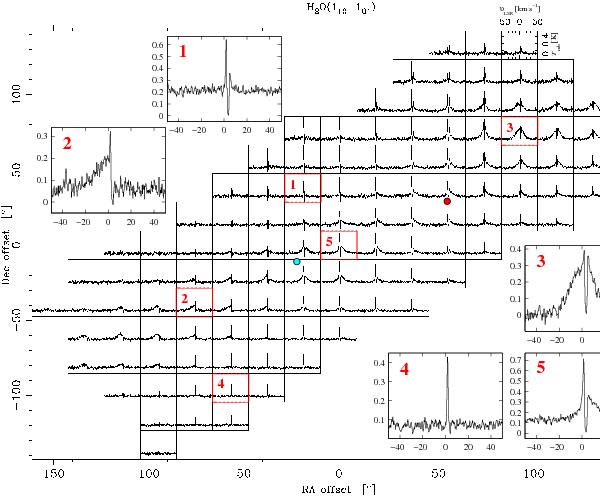
H2O (110 − 101) map obtained with HIFI. The data have been regridded onto a regular grid in RA and Dec. The spacing between each position is 19′′ and the map is centred on the Class 0 source VLA 1623 at α2000 = 16h26m26.4 , δ2000 = –24°24′31′′. All spectra are plotted on the Tmb-scale and velocities are with respect to the υLSR (from –50 to +50 km s-1). Note that the spectra in the enlarged insets have not been baseline subtracted, but corrected such that the offset shows the single side-band continuum level. The positions of B1 and R2 are indicated with coloured dots.
Current usage metrics show cumulative count of Article Views (full-text article views including HTML views, PDF and ePub downloads, according to the available data) and Abstracts Views on Vision4Press platform.
Data correspond to usage on the plateform after 2015. The current usage metrics is available 48-96 hours after online publication and is updated daily on week days.
Initial download of the metrics may take a while.