Fig. 4
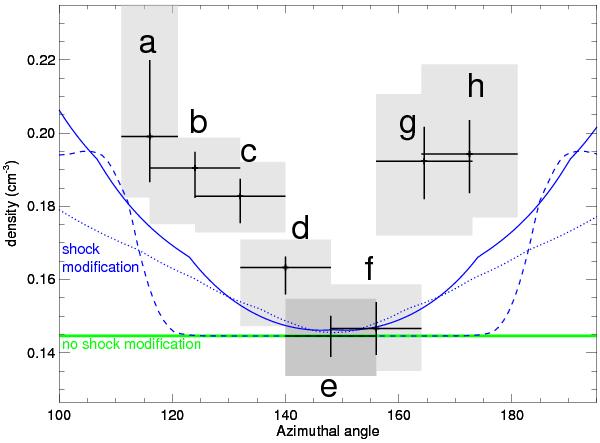
Azimuthal profile of the postshock ISM density (see regions in Fig. 1). Error bars are shown at the 68% (crosses) and 90% (shaded areas) confidence levels. The blue curves show the profiles predicted by Völk et al. (2003) with δB/B = 1 (dot) and 0.8 (dashed), and derived by the radio flux (solid curve, see text) by assuming the relationship between the injection efficiency and shock compression ratio adopted by Ferrand et al. (2010). The green line indicates the expected trend in the case of no shock modification.
Current usage metrics show cumulative count of Article Views (full-text article views including HTML views, PDF and ePub downloads, according to the available data) and Abstracts Views on Vision4Press platform.
Data correspond to usage on the plateform after 2015. The current usage metrics is available 48-96 hours after online publication and is updated daily on week days.
Initial download of the metrics may take a while.