Fig. 3
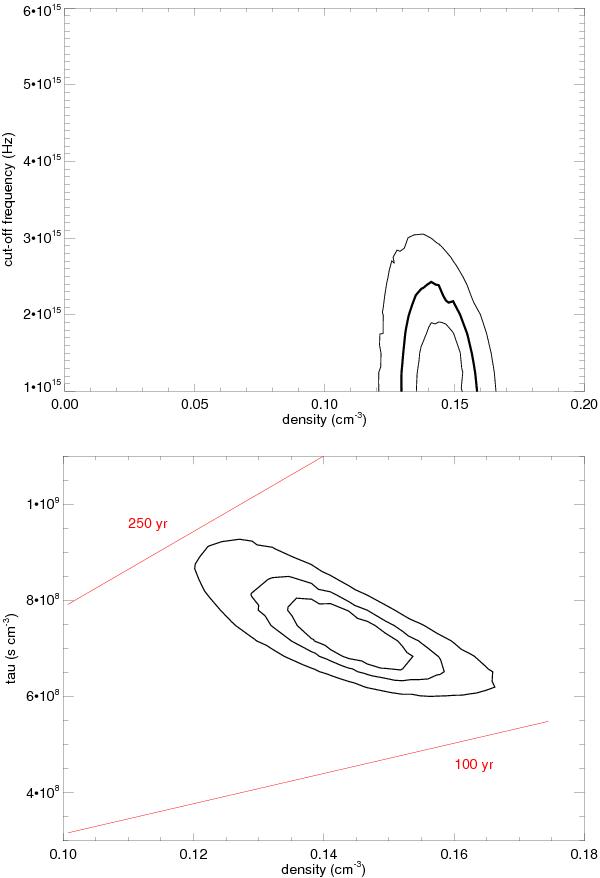
Upper panel: 68%, 90%, and 99% confidence contour levels of the ISM density and SRCUT break frequency derived from the spectrum of region e. Lower panel: 68%, 90%, and 99% confidence contour levels of the ISM density and the ISM ionization parameter derived from the spectrum of region e. The red curves are isochrones at 100 yr and 250 yr after the interaction with the shock front.
Current usage metrics show cumulative count of Article Views (full-text article views including HTML views, PDF and ePub downloads, according to the available data) and Abstracts Views on Vision4Press platform.
Data correspond to usage on the plateform after 2015. The current usage metrics is available 48-96 hours after online publication and is updated daily on week days.
Initial download of the metrics may take a while.