Free Access
Fig. 2
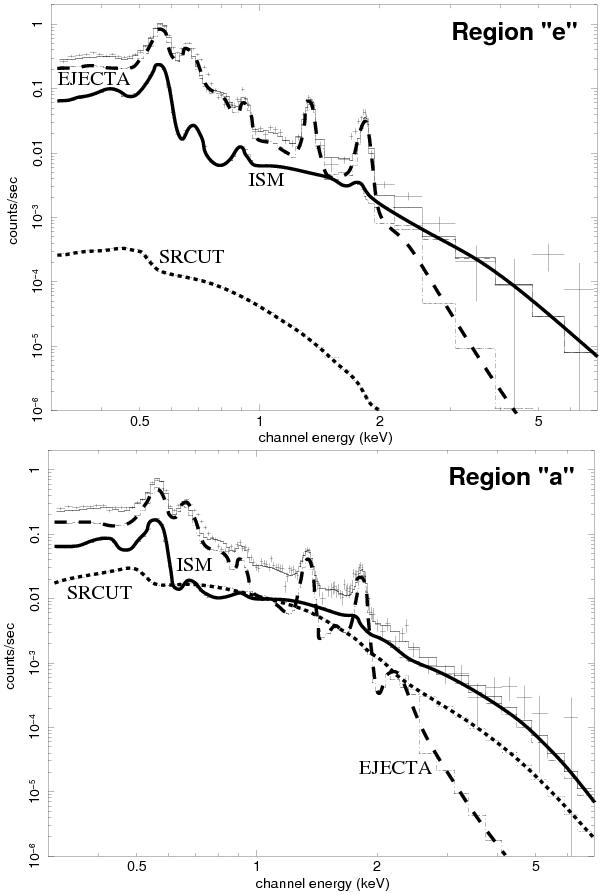
Upper panel: spectra of region e (see Fig. 1) with the corresponding best-fit model (see text). The contribution of each thermal (ISM, solid line, and ejecta, dashed line) and nonthermal (SRCUT, dotted line) components is shown. Only MOS spectra are shown for clarity. Lower panel: same as upper panel for region a.
This figure is made of several images, please see below:
Current usage metrics show cumulative count of Article Views (full-text article views including HTML views, PDF and ePub downloads, according to the available data) and Abstracts Views on Vision4Press platform.
Data correspond to usage on the plateform after 2015. The current usage metrics is available 48-96 hours after online publication and is updated daily on week days.
Initial download of the metrics may take a while.