Fig. 1
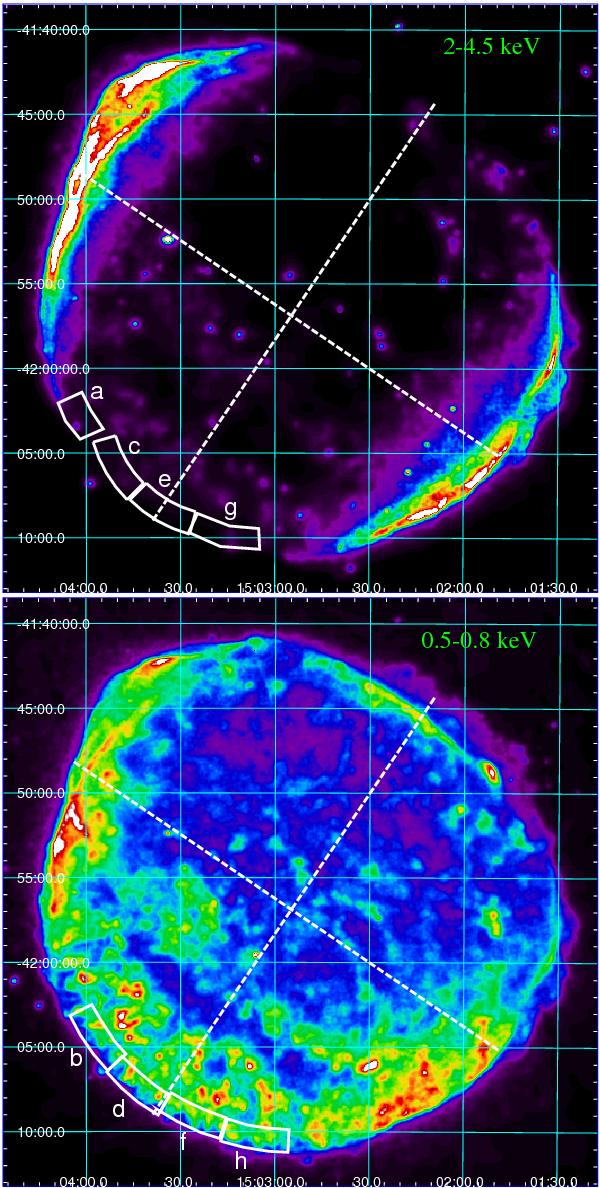
Upper panel: mosaicked count-rate images (MOS-equivalent counts per second per bin) of SN 1006 in the 2−4.5 keV band. The bin size is 4′′ and the image is adaptively smoothed to a signal-to-noise ratio ten. The regions selected for the spectral analysis of the rim are superimposed (four in the upper panel and four in the lower panel for clarity). North is up and East is to the left. The two dashed lines indicate the symmetry axis of the remnant, marking the center of the synchrotron limbs (northeast and southwest) and of thermal limbs (northwest and southeast). Lower panel: same as upper panel in the 0.5−0.8 keV energy band.
Current usage metrics show cumulative count of Article Views (full-text article views including HTML views, PDF and ePub downloads, according to the available data) and Abstracts Views on Vision4Press platform.
Data correspond to usage on the plateform after 2015. The current usage metrics is available 48-96 hours after online publication and is updated daily on week days.
Initial download of the metrics may take a while.