Fig. 4
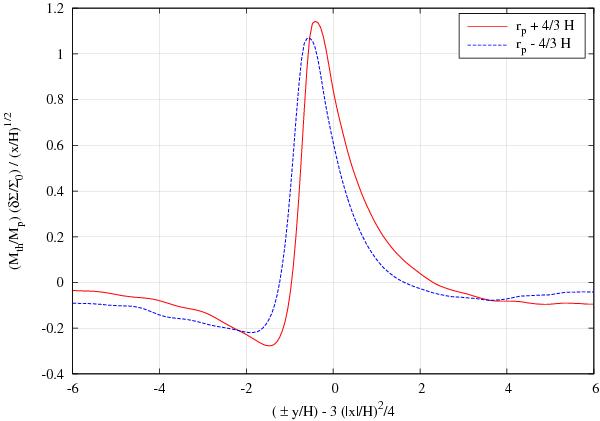
Normalized azimuthal density profile of the inner and outer wakes at radial distances ± 4/3H away from the planet at 30 Torb for the isothermal 2D standard model. The coordinates x and y refer to local Cartesian coordinates, see Eq. (15). The “plus” sign in the x-axis label refers to the blue curve at rp − 4/3H, and the “minus” sign to the red curve at rp + 4/3H. The upstream side of the wake is to the left for both curves.
Current usage metrics show cumulative count of Article Views (full-text article views including HTML views, PDF and ePub downloads, according to the available data) and Abstracts Views on Vision4Press platform.
Data correspond to usage on the plateform after 2015. The current usage metrics is available 48-96 hours after online publication and is updated daily on week days.
Initial download of the metrics may take a while.