Fig. 6
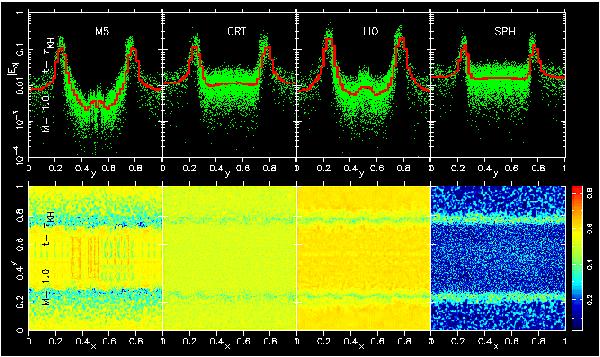
Top panels: distribution at time t = τKH of the errors | Ei0 | plotted versus y, as defined by Eq. (36), for the KH runs with Mach number M = 1 and different simulation parameters (See Table 2). The red histograms show the mean values of the binned distributions. Bottom panels: each panel shows the nearest neighbor map of the run in the corresponding top panel. This is defined as the distribution, interpolated at the map grid points of the normalized distances  , where
  is the distance | xi − xk | of the kth neighbor of the particle i and the neighbors are sorted so that
  .
.
Current usage metrics show cumulative count of Article Views (full-text article views including HTML views, PDF and ePub downloads, according to the available data) and Abstracts Views on Vision4Press platform.
Data correspond to usage on the plateform after 2015. The current usage metrics is available 48-96 hours after online publication and is updated daily on week days.
Initial download of the metrics may take a while.