Fig. 5
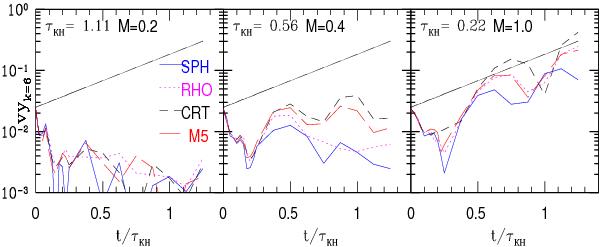
Time evolution of the velocity field amplitude in the y direction, as measured by the kλ = 12π mode of the Fourier transform of vy, for some of the KH instability tests described in Sect. 3.1. Each panel refers to KH simulations performed with the same Mach number, the initial conditions set-up being given in Table 1. Within each panel, the different curves are for AC-SPH runs with different simulation parameters, as specified in Table 2. The black solid line indicates the expected linear-theory growth rate.
Current usage metrics show cumulative count of Article Views (full-text article views including HTML views, PDF and ePub downloads, according to the available data) and Abstracts Views on Vision4Press platform.
Data correspond to usage on the plateform after 2015. The current usage metrics is available 48-96 hours after online publication and is updated daily on week days.
Initial download of the metrics may take a while.