Fig. 8
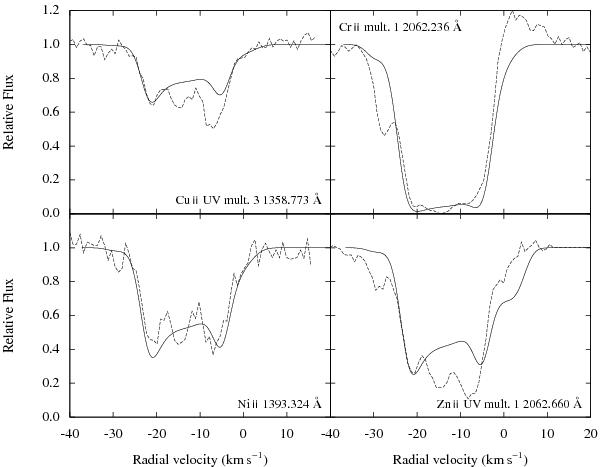
Comparison of theoretical line profiles (solid curves) corresponding to a mass-loss rate of Ṁ = 2 × 10⁻⁶ M⊙ yr-1 and a wind velocity of ν∞ = 20 km s-1 with observations (dashed curves), including a velocity calibration provided by the UVES spectra (see Sect. 3.2.2) and a systemic velocity of −1.3 km s-1. The relative flux is given as a function of the observed radial velocity.
Current usage metrics show cumulative count of Article Views (full-text article views including HTML views, PDF and ePub downloads, according to the available data) and Abstracts Views on Vision4Press platform.
Data correspond to usage on the plateform after 2015. The current usage metrics is available 48-96 hours after online publication and is updated daily on week days.
Initial download of the metrics may take a while.