Fig. 2
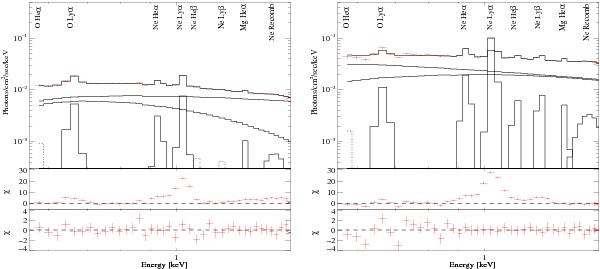
Top panels: Eight Gaussian lines from the ~1 keV complex detected by Suzaku, before (left panel) and after (right panel) the 2008 torque reversal. Here the dotted lines in the model denote the components that were fixed. The residuals after fitting only the continuum model are shown in the middle panel, with no line emission included. The bottom panel shows the residuals after fitting the line complex with those 8 lines (see Table 2 for more information about these lines).
Current usage metrics show cumulative count of Article Views (full-text article views including HTML views, PDF and ePub downloads, according to the available data) and Abstracts Views on Vision4Press platform.
Data correspond to usage on the plateform after 2015. The current usage metrics is available 48-96 hours after online publication and is updated daily on week days.
Initial download of the metrics may take a while.