Fig. 1
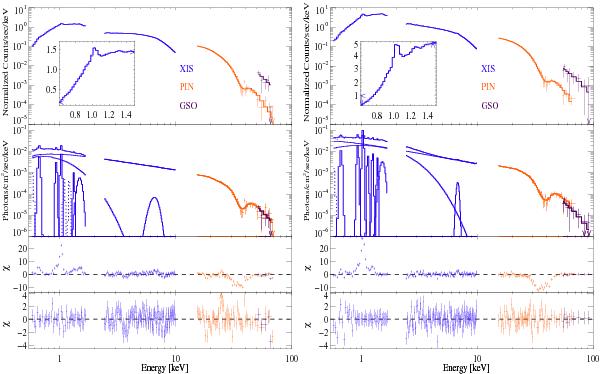
Top panels: Suzaku broad-band spectrum before (left panel) and after (right panel) the 2008 torque reversal. Blue points denote XIS data (0.5−10 keV), PIN data points are in red (14−70 keV) and GSO in purple (50−70 keV and 50−100 keV, respectively). The residuals after fitting only the continuum model are shown in the middle panel, with no line emission and cyclotron line feature included. The bottom panel shows the residuals after fitting the line complex at ~1 keV, the ~6.5 keV iron line and the ~37 keV cyclotron line (see Table 1 for a list of fitted parameters). A zoom of the region of the line complex at ~1 keV is also shown for clarity.
Current usage metrics show cumulative count of Article Views (full-text article views including HTML views, PDF and ePub downloads, according to the available data) and Abstracts Views on Vision4Press platform.
Data correspond to usage on the plateform after 2015. The current usage metrics is available 48-96 hours after online publication and is updated daily on week days.
Initial download of the metrics may take a while.