Fig. 7
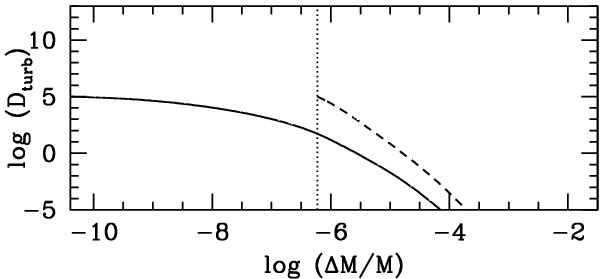
Turbulent diffusion coefficient (according to Eq. (5)) in a 1.7 M⊙-model computed with TGEC at two evolutionary stages. The solid line represents the diffusion coefficient below the surface convective zone (due to the ionization of H and He) at 170 Myr, the dashed line represents the diffusion coefficient below the iron convective zone (assumed connected with the H and He ones) at 588 Myr, the vertical dotted line represents the base of the iron convective zone.
Current usage metrics show cumulative count of Article Views (full-text article views including HTML views, PDF and ePub downloads, according to the available data) and Abstracts Views on Vision4Press platform.
Data correspond to usage on the plateform after 2015. The current usage metrics is available 48-96 hours after online publication and is updated daily on week days.
Initial download of the metrics may take a while.