Fig. 2
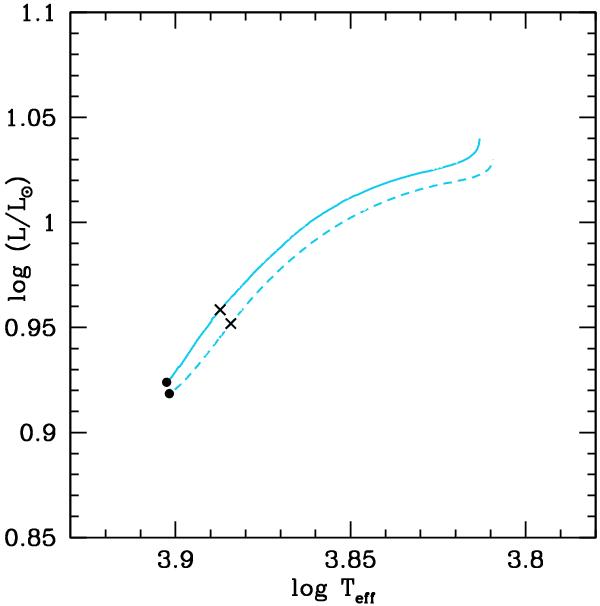
Evolutionary tracks of two 1.7 M⊙ sequences computed with TGEC or with the Montreal code. The dashed curve represents the 5.3D50-3 model presented in Richard et al. (2001) (and computed with the Montreal code). The solid curve represents a model computed with TGEC and including similar input physic. The black dots and crosses respectively represent the 30 and 400 Myr-models.
Current usage metrics show cumulative count of Article Views (full-text article views including HTML views, PDF and ePub downloads, according to the available data) and Abstracts Views on Vision4Press platform.
Data correspond to usage on the plateform after 2015. The current usage metrics is available 48-96 hours after online publication and is updated daily on week days.
Initial download of the metrics may take a while.