Fig. 10
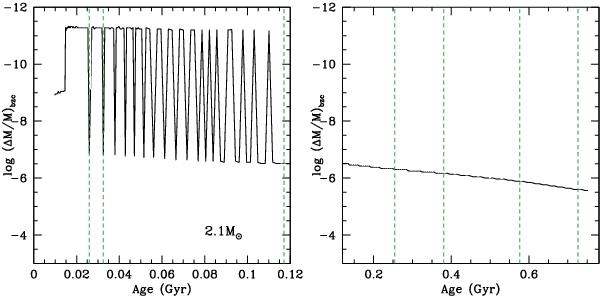
Variation with time of the bottom of the surface convective zone in the 2.1 M⊙ model represented in Fig. 8. Left panel: zoom on the 0–0.12 Gyr period. Right panel: zoom on the 0.12–0.8 Gyr period. The dashed vertical lines are located respectively at 25.9 Myr, 32.6 Myr, 117.1 Myr, 254.3 Myr, 380.3 Myr, 576.0 Myr, and 726.0 Myr.
Current usage metrics show cumulative count of Article Views (full-text article views including HTML views, PDF and ePub downloads, according to the available data) and Abstracts Views on Vision4Press platform.
Data correspond to usage on the plateform after 2015. The current usage metrics is available 48-96 hours after online publication and is updated daily on week days.
Initial download of the metrics may take a while.