Fig. 8
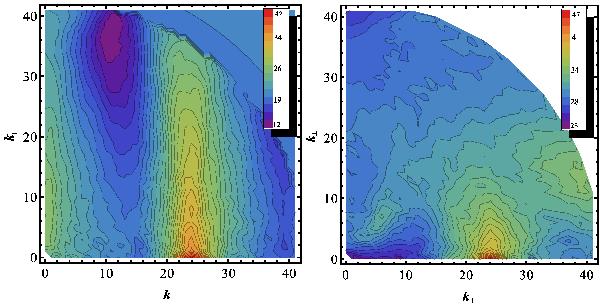
Simulation setup SI: comparison between growth rates Γ1 and Γ2 at peak position  at maximum drive time. Although the effective energy input varies by a factor 100 (see Table 4) another transport mechanism becomes dominant. The smaller peak (Γ1) develops dominantly in the perpendicular direction while the evolution of bigger peak (Γ2) is more isotropic and tends towards smaller k∥. The colours indicate the logarithm of the total spectral energy.
Current usage metrics show cumulative count of Article Views (full-text article views including HTML views, PDF and ePub downloads, according to the available data) and Abstracts Views on Vision4Press platform.
Data correspond to usage on the plateform after 2015. The current usage metrics is available 48-96 hours after online publication and is updated daily on week days.
Initial download of the metrics may take a while.