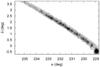
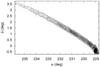
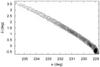
Fig. A.2
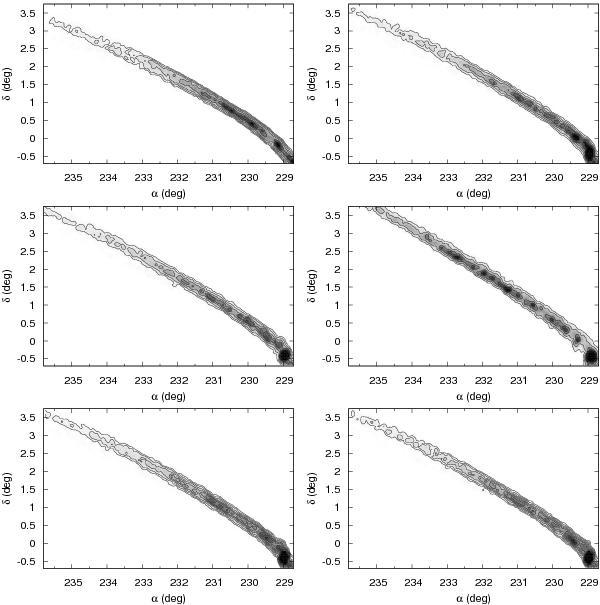
Isodensity contour plots for the trailing tail of the cluster for different N-body simulations having orbits with vr = −44.3 km s-1 and vt = 80 km s-1 (upper left panel), vr = −44.3 km s-1 and vt = 89 km s-1 (upper right panel), vr = −44.3 km s-1 and vt = 91 km s-1 (middle left panel), vr = −44.3 km s-1 and vt = 110 km s-1 (middle right panel), vr = −42 km s-1 and vt = 90 km s-1 (bottom left panel), vr = −46 km s-1 and vt = 90 km s-1 (bottom right panel). See upper panel of Fig. 2 for a comparison with the isodensity contours of the standard orbit
Current usage metrics show cumulative count of Article Views (full-text article views including HTML views, PDF and ePub downloads, according to the available data) and Abstracts Views on Vision4Press platform.
Data correspond to usage on the plateform after 2015. The current usage metrics is available 48-96 hours after online publication and is updated daily on week days.
Initial download of the metrics may take a while.