Fig. A.1
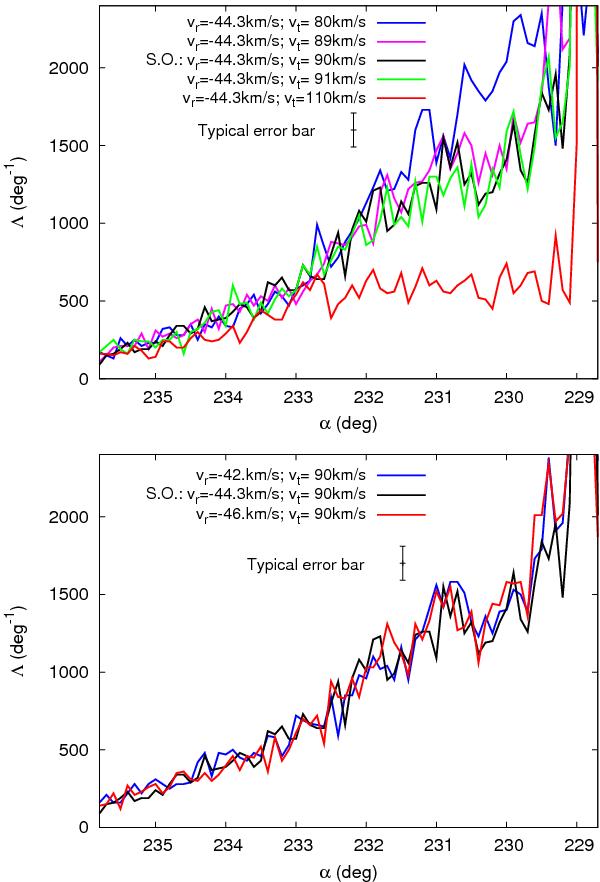
Upper panel: linear density of the trailing tail, as a function of the distance from the cluster center, for different orbits having the same radial velocity of the standard orbit (S.O., black line), i.e. −44.3 km s-1, and vt = 80 km s-1 (blue line), vt = 89 km s-1 (magenta line), vt = 91 km s-1 (green line), or vt = 110 km s-1 (red line). Lower panel: the same but for orbits having the same tangential velocity of the standard orbit (S.O., black line), i.e. 90 km s-1, and vr = −42 km s-1 (blue line) or vr = −46 km s-1 (red line). The typical Poisson’s uncertainty is shown.
Current usage metrics show cumulative count of Article Views (full-text article views including HTML views, PDF and ePub downloads, according to the available data) and Abstracts Views on Vision4Press platform.
Data correspond to usage on the plateform after 2015. The current usage metrics is available 48-96 hours after online publication and is updated daily on week days.
Initial download of the metrics may take a while.