Fig. 2
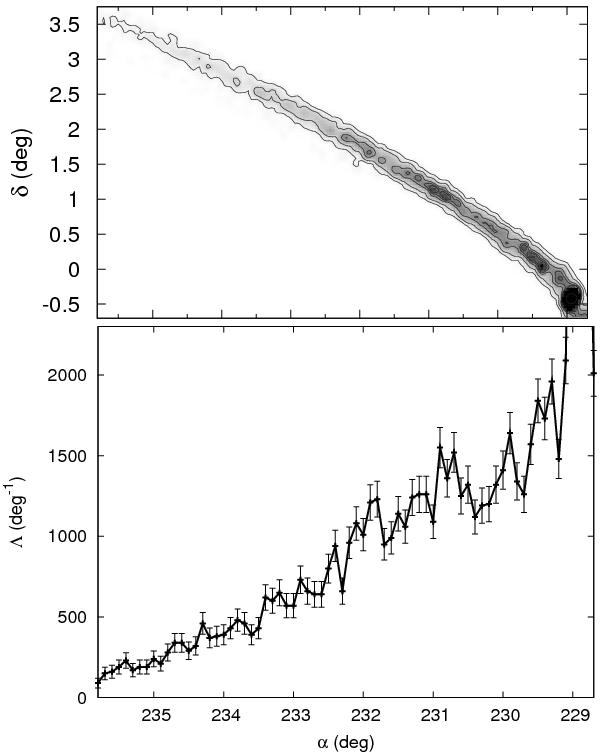
Upper panel: the trailing tail at the end of the N-body simulation. The contour lines in the tails refer to 740, 2200, 4800, 6300 and 7400 M⊙/deg2. Bottom panel: linear density of the trailing tail shown in the upper panel, as a function of the right ascension α. The cluster is on the right of the panel. Error bars are Poisson errors.
Current usage metrics show cumulative count of Article Views (full-text article views including HTML views, PDF and ePub downloads, according to the available data) and Abstracts Views on Vision4Press platform.
Data correspond to usage on the plateform after 2015. The current usage metrics is available 48-96 hours after online publication and is updated daily on week days.
Initial download of the metrics may take a while.