Free Access
Fig. 6
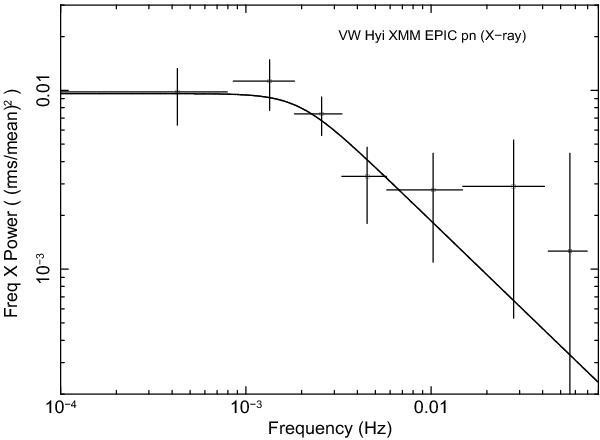
X-ray power spectrum of VW Hyi in quiescence obtained from the XMM-Newton EPIC data. Overplotted curve is the fitted propagating fluctuations model. The reduced χ2 of the fit to the XMM-Newton (EPIC pn) PDS is 0.5.
Current usage metrics show cumulative count of Article Views (full-text article views including HTML views, PDF and ePub downloads, according to the available data) and Abstracts Views on Vision4Press platform.
Data correspond to usage on the plateform after 2015. The current usage metrics is available 48-96 hours after online publication and is updated daily on week days.
Initial download of the metrics may take a while.