Fig. 10
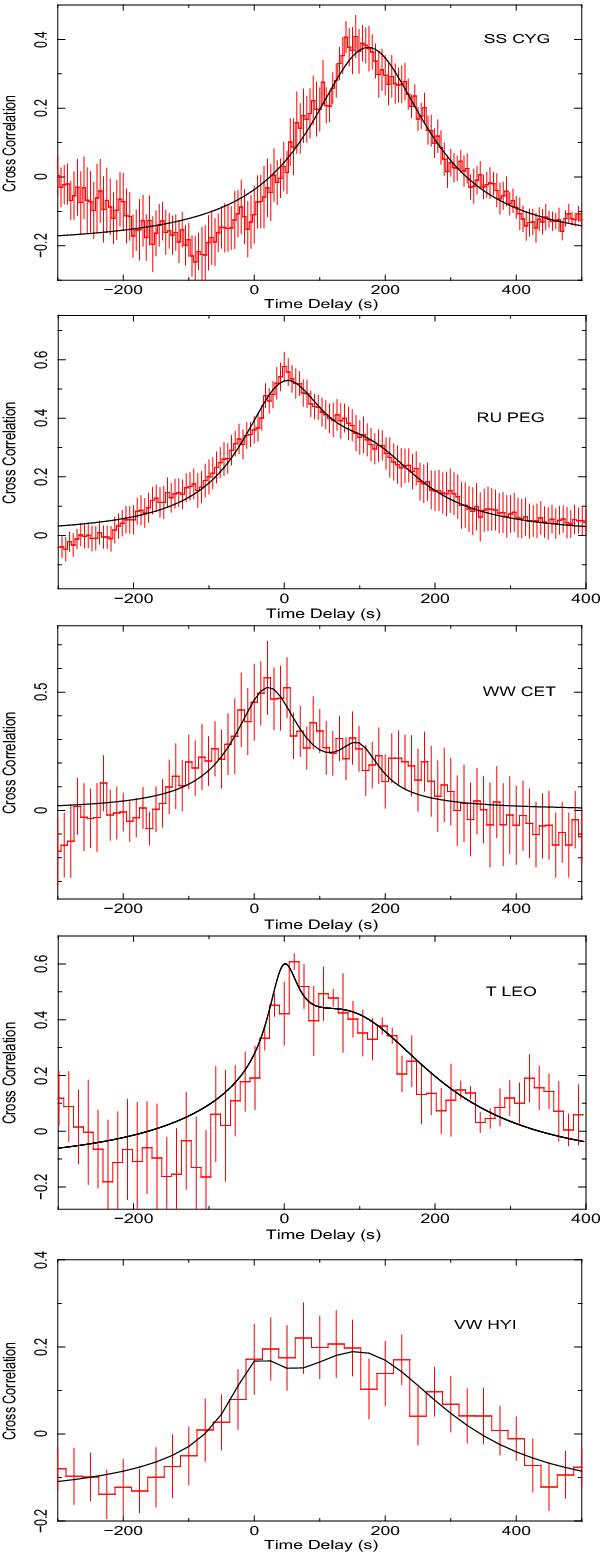
Cross-correlation of the EPIC pn (X-ray) and OM (UV) light curves with 1 s time resolution. The CCFs are displayed for SS Cyg, RU Peg, WW Cet, T Leo, and VW Hyi from the top to the bottom of the figure. The correlation coefficient is normalized to a maximum value of 1. The two-component Lorenzian fits are shown as solid black lines (except for SS Cyg where a single Lorentzian was used). The reduced χ2 values are 0.8, 0.4, 0.45, 1.2, and 0.45 from the top to the bottom panels of the figure.
Current usage metrics show cumulative count of Article Views (full-text article views including HTML views, PDF and ePub downloads, according to the available data) and Abstracts Views on Vision4Press platform.
Data correspond to usage on the plateform after 2015. The current usage metrics is available 48-96 hours after online publication and is updated daily on week days.
Initial download of the metrics may take a while.