Fig. 3
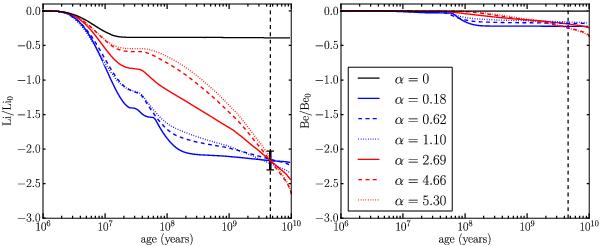
Calibration of α for different rotational histories (represented with the same colour-coding as in Fig. 2) of a 1 M⊙ star using solar values for the ratio of present to initial abundances of Li (Li/Li0 = 1/140, see left panel). The black error bar shows the range 100 ≲ d(Li) ≲ 200. The right panel shows the corresponding depletion of beryllium and the calibrated values of α. In both panels, the case without rotational mixing is shown for reference (black continuous line).
Current usage metrics show cumulative count of Article Views (full-text article views including HTML views, PDF and ePub downloads, according to the available data) and Abstracts Views on Vision4Press platform.
Data correspond to usage on the plateform after 2015. The current usage metrics is available 48-96 hours after online publication and is updated daily on week days.
Initial download of the metrics may take a while.