Fig. 1
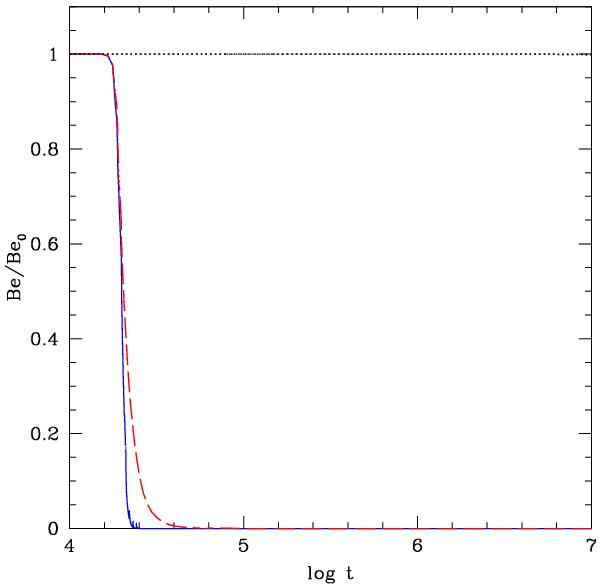
Abundance of Be (divided by the initial abundance Be0) versus time (in yr) in stars that have undergone a given number Nburst of accretion bursts with Ṁ = 5 × 10⁻⁴ M⊙ yr-1 and duration Δtburst = 100 yr. The blue solid line corresponds to an accreting sequence with final mass 1 M⊙ with Nburst = 20 bursts. The red dashed line corresponds to a final mass 0.8 M⊙ with Nburst = 16. The accretion process starts from an initial seed mass of 10 MJ (see Baraffe & Chabrier 2010, for details). The black dotted line indicates the Be abundance for non-accreting models of 0.8 M⊙ or 1 M⊙, which are the same for both masses since Be is not depleted in those models.
Current usage metrics show cumulative count of Article Views (full-text article views including HTML views, PDF and ePub downloads, according to the available data) and Abstracts Views on Vision4Press platform.
Data correspond to usage on the plateform after 2015. The current usage metrics is available 48-96 hours after online publication and is updated daily on week days.
Initial download of the metrics may take a while.