Fig. 8
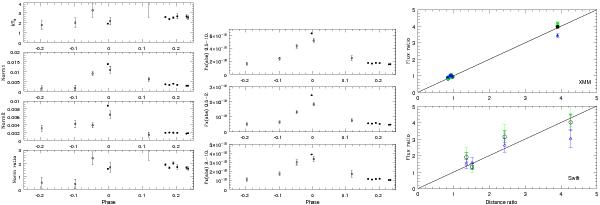
Variations in the spectral parameters (left) and observed flux (middle) with phase, for the best-fit model with the first temperature and the absorptions fixed. The solid and open symbols correspond to XMM-Newton and Swift data, respectively. The right panel shows, for the same model, the flux ratio  as a function of the inverse stellar separation ratio Dref/D for the XMM-Newton and Swift data. The reference data corresponds to the first observation of each dataset, i.e., data from Oct. 04 for XMM-Newton and data from Jan. 11 for Swift. The black circles corresponds to the total, 0.5–10.0 keV flux, the green squares to the soft, 0.5–2.0 keV flux, and the blue triangles to the hard, 2.0–10.0 keV flux.
Current usage metrics show cumulative count of Article Views (full-text article views including HTML views, PDF and ePub downloads, according to the available data) and Abstracts Views on Vision4Press platform.
Data correspond to usage on the plateform after 2015. The current usage metrics is available 48-96 hours after online publication and is updated daily on week days.
Initial download of the metrics may take a while.