Free Access
Fig. 9
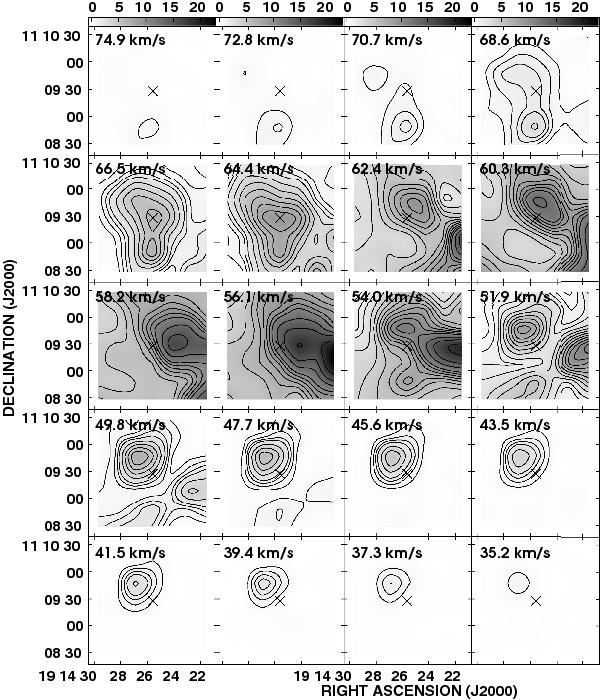
Velocity channel maps of the 12CO J = 3–2 emission averaged every 2.1 km s-1. The given velocities correspond to the higher velocity of each interval. Grayscale goes up to 23 K. Contours are above the 5σ of the rms noise level. The cross indicates the position of G45.47.
Current usage metrics show cumulative count of Article Views (full-text article views including HTML views, PDF and ePub downloads, according to the available data) and Abstracts Views on Vision4Press platform.
Data correspond to usage on the plateform after 2015. The current usage metrics is available 48-96 hours after online publication and is updated daily on week days.
Initial download of the metrics may take a while.