Free Access
Fig. 6
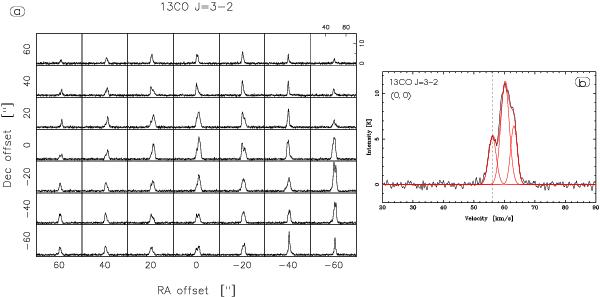
a) 13CO J = 3–2 spectra obtained towards the 2′ × 2′ region (white box in Fig. 1-left) mapped with ASTE. b) Hanning smoothed profile of the 13CO J = 3–2 line towards G45.47. The dashed line indicates the systemic velocity of the gas. The spectrum was deconstructed using three Gaussians, which are shown in red.
Current usage metrics show cumulative count of Article Views (full-text article views including HTML views, PDF and ePub downloads, according to the available data) and Abstracts Views on Vision4Press platform.
Data correspond to usage on the plateform after 2015. The current usage metrics is available 48-96 hours after online publication and is updated daily on week days.
Initial download of the metrics may take a while.