Fig. 12
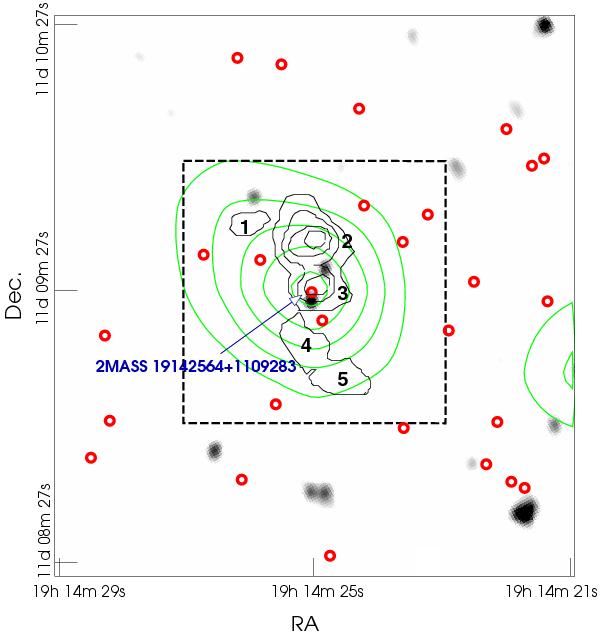
Radio continuum emission at 6 cm (MAGPIS; White et al. 2005) of the area mapped using ASTE. The green contours represent the HCO+J = 4–3 emission distribution integrated between 58 and 67 km s-1. The black contours were taken from the paper of Wilner et al. (1996) and represent the HCO+J = 1–0 emission distribution integrated from 58 and 67 km s-1. The box indicates the area observed by Wilner et al. (1996). The numbers show the five HCO+J = 1–0 clumps. The red circles represent the YSO candidates shown in Fig. 13.
Current usage metrics show cumulative count of Article Views (full-text article views including HTML views, PDF and ePub downloads, according to the available data) and Abstracts Views on Vision4Press platform.
Data correspond to usage on the plateform after 2015. The current usage metrics is available 48-96 hours after online publication and is updated daily on week days.
Initial download of the metrics may take a while.