Fig. 11
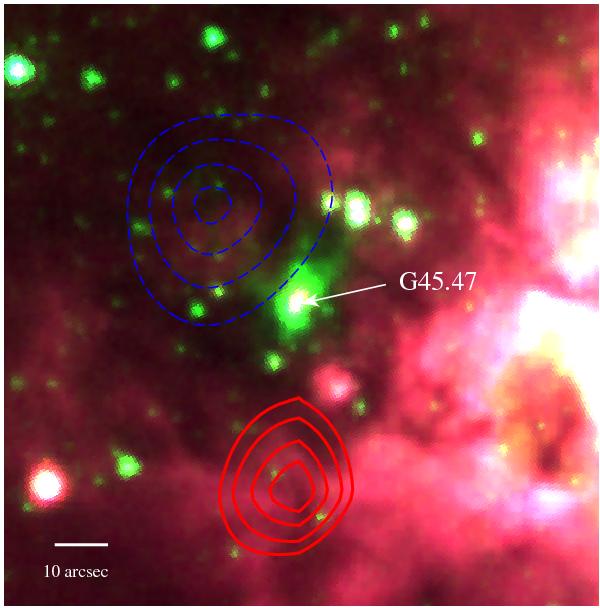
Spitzer-IRAC three-color image (3.6 μm = blue, 4.5 μm = green, and 8 μm = red) of G45.47. The blue and red contours represent the 12CO J = 3–2 emission integrated from 34 to 54 km s-1 (blue lobe), and from 64 to 75 km s-1 (red lobe). The blue contours are at 400, 500, 600, and 670 K km s-1 and the red ones are at 140, 160, 180, and 200 K km s-1.
Current usage metrics show cumulative count of Article Views (full-text article views including HTML views, PDF and ePub downloads, according to the available data) and Abstracts Views on Vision4Press platform.
Data correspond to usage on the plateform after 2015. The current usage metrics is available 48-96 hours after online publication and is updated daily on week days.
Initial download of the metrics may take a while.