Free Access
Fig. 10
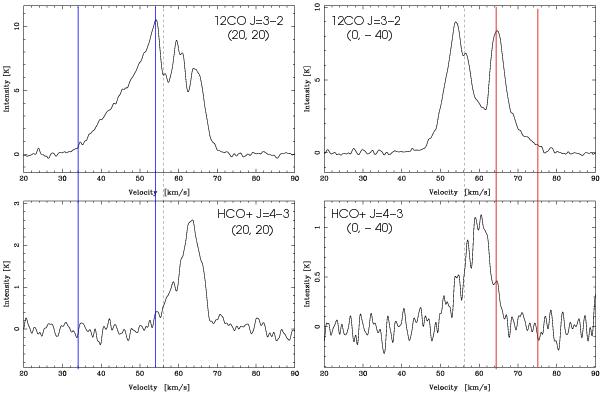
Comparison between the 12CO J = 3–2 and the HCO+J = 4–3 spectra on the positions (20, 20) and (0, –40). The dashed line indicates the systemic velocity. The velocity intervals corresponding to the blue and red wings are shown. The four spectra were Hanning smoothed.
Current usage metrics show cumulative count of Article Views (full-text article views including HTML views, PDF and ePub downloads, according to the available data) and Abstracts Views on Vision4Press platform.
Data correspond to usage on the plateform after 2015. The current usage metrics is available 48-96 hours after online publication and is updated daily on week days.
Initial download of the metrics may take a while.