Free Access
Fig. 1
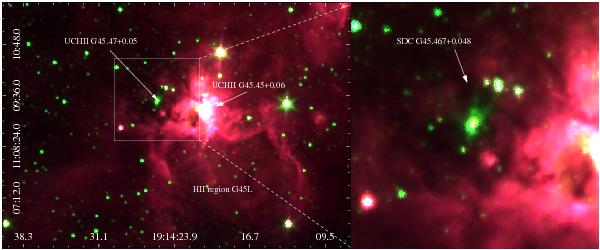
Spitzer-IRAC three-color images (3.6 μm = blue, 4.5 μm = green, and 8 μm = red). The white box in the left panel indicates the region mapped with ASTE. A close up view of this region is shown in the right panel. Red, green, and blue scales go from 30 to 500, from 2 to 110, and from 1 to 80 MJy/sr, respectively.
Current usage metrics show cumulative count of Article Views (full-text article views including HTML views, PDF and ePub downloads, according to the available data) and Abstracts Views on Vision4Press platform.
Data correspond to usage on the plateform after 2015. The current usage metrics is available 48-96 hours after online publication and is updated daily on week days.
Initial download of the metrics may take a while.