Fig. 9
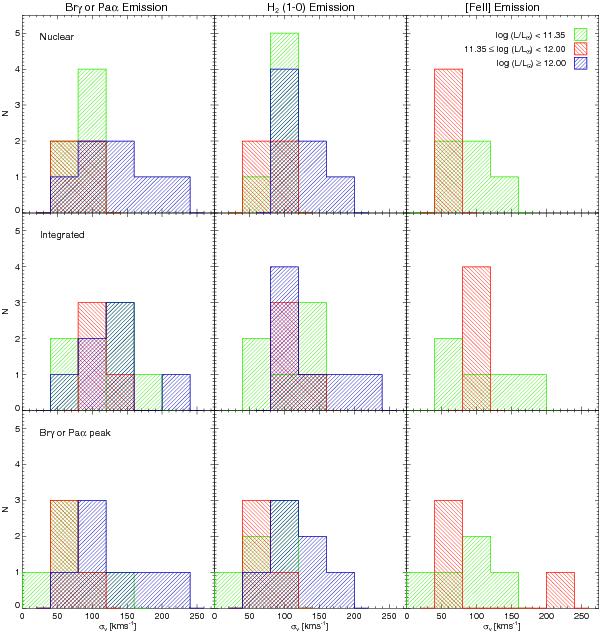
Distributions of the velocity dispersion of the ionised gas (Brγ for LIRGs Paα for ULIRGs), H2 1−0S(1), and [FeII] emission. From top to bottom, the histograms show the distributions of the velocity dispersion measured in the nucleus (defined by aperture “A” in Figs. 1 and 2), the integrated FoV, and the peak of the Brγ (Paα) emission. The Brγ (Paα) peak coincides with the nucleus in ~33% of the LIRGs and in the ~71% of the ULIRGs.
Current usage metrics show cumulative count of Article Views (full-text article views including HTML views, PDF and ePub downloads, according to the available data) and Abstracts Views on Vision4Press platform.
Data correspond to usage on the plateform after 2015. The current usage metrics is available 48-96 hours after online publication and is updated daily on week days.
Initial download of the metrics may take a while.