Fig. 6
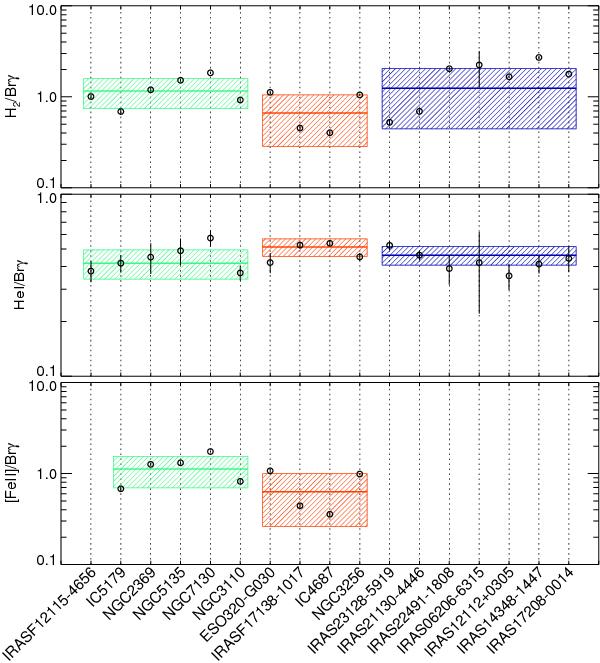
H2/Brγ (top), HeI/Brγ (centre), and [FeII]/Brγ (bottom) line ratios of the galaxies of the sample, ordered by increasing LIR. The values are measured in the integrated spectra. The weighted mean of each luminosity bin (low, log(LIR/L⊙) < 11.35; intermediate, 11.35 ≤ log(LIR/L⊙) < 12 and high, log(LIR/L⊙) ≥ 12) is plotted as a thick line, whereas the box represents the standard deviation of the values. Since all the ULIRGs and one LIRG were not observed in the H-band, [FeII]/Brγ data are presented for only nine LIRGs.
Current usage metrics show cumulative count of Article Views (full-text article views including HTML views, PDF and ePub downloads, according to the available data) and Abstracts Views on Vision4Press platform.
Data correspond to usage on the plateform after 2015. The current usage metrics is available 48-96 hours after online publication and is updated daily on week days.
Initial download of the metrics may take a while.