Fig. 5
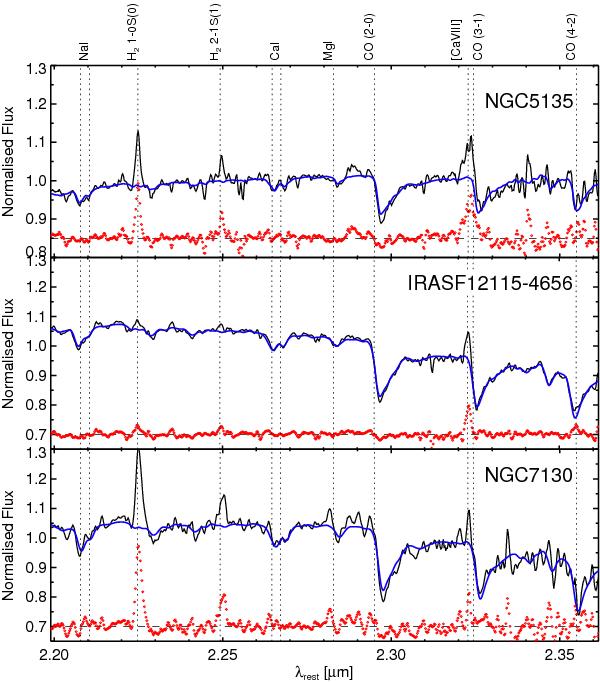
Zoom around the region containing the stellar absorption features and the coronal line [CaVIII] at 2.321 μm for three of the objects where coronal emission is detected. Spectra correspond to the brightest spaxel in [SiVI] (see Fig. 4). The pPXF fitting of the stellar absorptions is plotted in blue, and the residuals from the fitting are shown as a red dotted line.
Current usage metrics show cumulative count of Article Views (full-text article views including HTML views, PDF and ePub downloads, according to the available data) and Abstracts Views on Vision4Press platform.
Data correspond to usage on the plateform after 2015. The current usage metrics is available 48-96 hours after online publication and is updated daily on week days.
Initial download of the metrics may take a while.