Fig. 3
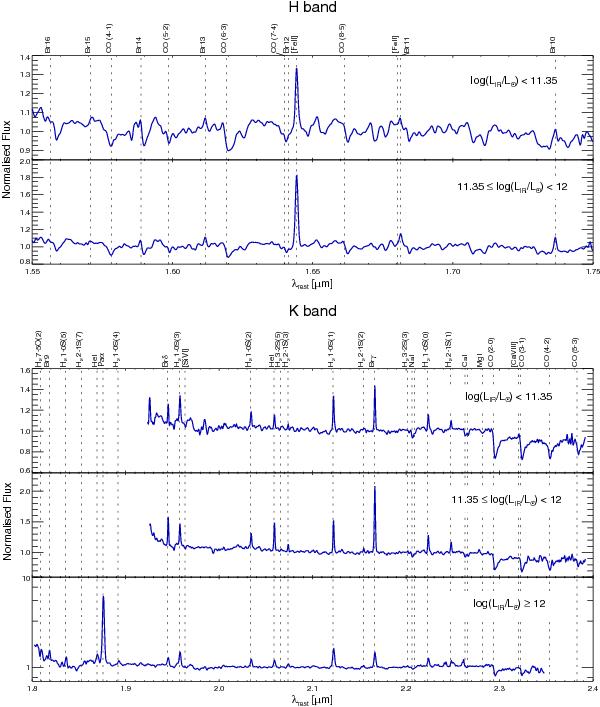
H- and K-band stacked spectra of the SINFONI sample, divided into three subsets with log(LIR/L⊙) < 11.35, 11.35 ≤ log(LIR/L⊙) < 12, and log(LIR/L⊙) ≥ 12. The spectra are normalised to a linear fit of the continuum measured within the intervals [1.600, 1.610] μm and [1.690, 1.700] μm for the H band and [2.080, 2.115] μm and [2.172, 2.204] μm for the K band. From top to bottom, H-band and K-band spectra of the different subsets by increasing LIR. The spectra are available in electronic form at the CDS.
Current usage metrics show cumulative count of Article Views (full-text article views including HTML views, PDF and ePub downloads, according to the available data) and Abstracts Views on Vision4Press platform.
Data correspond to usage on the plateform after 2015. The current usage metrics is available 48-96 hours after online publication and is updated daily on week days.
Initial download of the metrics may take a while.