Fig. 1a
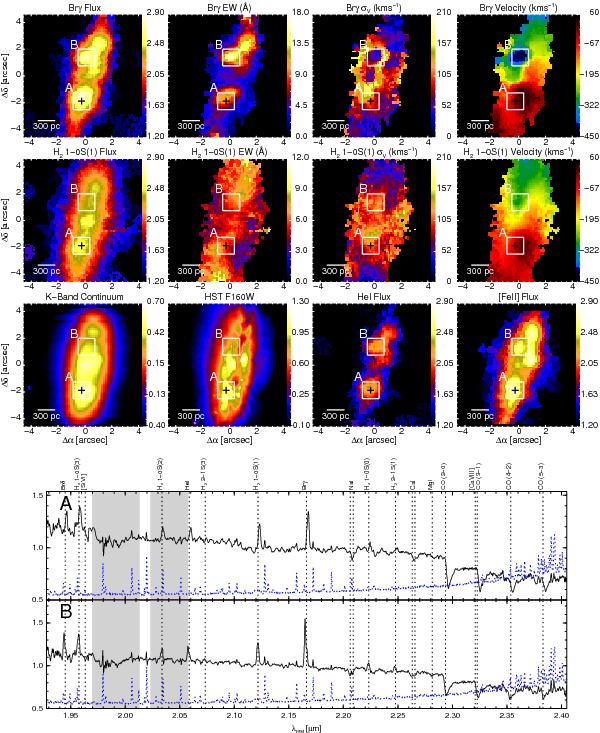
NGC 2369. Top and middle panels are SINFONI observed maps (not corrected from extinction) of the lines Brγ λ2.166 μm, and H2 1−0S(1)λ 2.122 μm. From left to right: flux, equivalent width, velocity dispersion and velocity. Lower panel shows, from left to right, the K band emission from our SINFONI data, HST/NICMOS F160W continuum image from the archive, HeIλ2.059 μm, and [FeII]λ1.644 μm emission maps. The brightest spaxel of the SINFONI K band is marked with a cross. The apertures used to extract the spectra at the bottom of the figure are drawn as white squares and labelled accordingly. At the bottom, the two rest-frame spectra extracted from apertures “A” and “B” are in black. The most relevant spectral features are labelled at the top and marked with a dotted line. The sky spectrum is overplotted as a dashed blue line, and the wavelength ranges of the water vapour atmospheric absorptions are marked in light grey.
Current usage metrics show cumulative count of Article Views (full-text article views including HTML views, PDF and ePub downloads, according to the available data) and Abstracts Views on Vision4Press platform.
Data correspond to usage on the plateform after 2015. The current usage metrics is available 48-96 hours after online publication and is updated daily on week days.
Initial download of the metrics may take a while.