Fig. 6
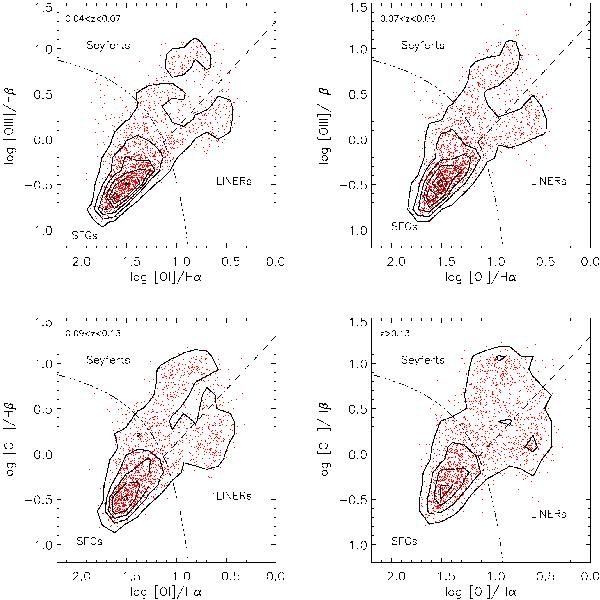
[Oi]-based diagnostic diagrams for the optical-radio sample. From top to bottom and from left to right, z increases. The number of radio emitters per bin is constant and equal to 2350 ± 5. The contours represent the number density of the radio emitters (20 galaxies per level). The bulk of the population is always placed in the SF region, though the number of AGNs slightly increases with z.
Current usage metrics show cumulative count of Article Views (full-text article views including HTML views, PDF and ePub downloads, according to the available data) and Abstracts Views on Vision4Press platform.
Data correspond to usage on the plateform after 2015. The current usage metrics is available 48-96 hours after online publication and is updated daily on week days.
Initial download of the metrics may take a while.