Fig. 10
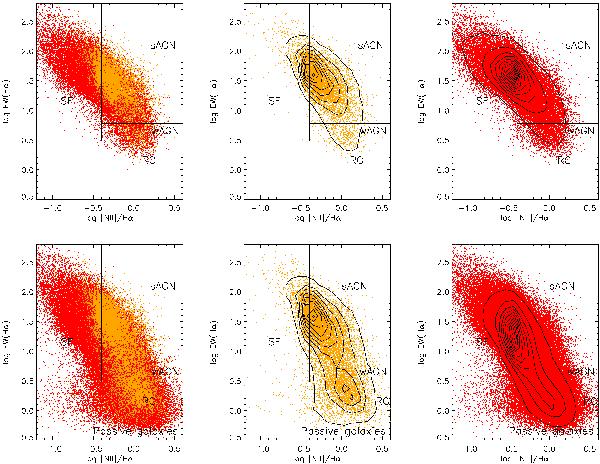
WHAN diagnostic diagrams for the cross-matched (orange) and the SDSS (red) samples. The upper-left panel shows the radio emitters of the SDSS superimposed on the SDSS parent sample. The lower panels represent samples where a less severe error cut (only on [Nii] and Hα) has been applied. In this way, a considerable number of objects have been recovered, which appear to be classified as wAGNs or RGs. Density levels represent 70 galaxies per contour in the middle panels, 500 galaxies per contour in the upper-right panel and 2000 galaxies per contour in the bottom-right panel.
Current usage metrics show cumulative count of Article Views (full-text article views including HTML views, PDF and ePub downloads, according to the available data) and Abstracts Views on Vision4Press platform.
Data correspond to usage on the plateform after 2015. The current usage metrics is available 48-96 hours after online publication and is updated daily on week days.
Initial download of the metrics may take a while.