Fig. 1
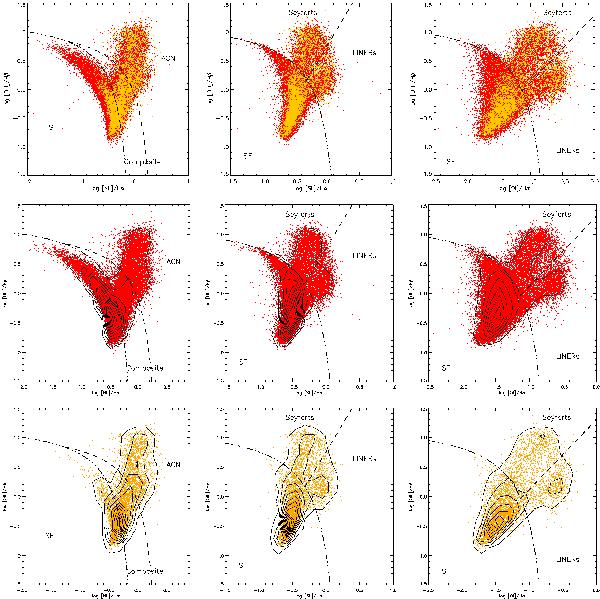
Optical emission-line diagnostic diagrams. The SDSS (DR7) targets are represented in red, while the radio emitters from the cross-matched sample are plotted in orange. Demarcation curves in the left panels ([Nii] diagram) are by Kewley et al. (2001) (dashed) and Kauffmann et al. (2003) (dot-dashed); in the middle ([Sii] diagram) and right ([Oi] diagram) panels, the demarcation curves are by Kewley et al. (2006). The top panels show the SDSS targets overplotted with the radio emitters. The middle and bottom panels show the density function of our data distribution. Density levels represent 700 galaxies per contour in case of SDSS targets, while it is 70 for the radio emitters.
Current usage metrics show cumulative count of Article Views (full-text article views including HTML views, PDF and ePub downloads, according to the available data) and Abstracts Views on Vision4Press platform.
Data correspond to usage on the plateform after 2015. The current usage metrics is available 48-96 hours after online publication and is updated daily on week days.
Initial download of the metrics may take a while.