Fig. 9
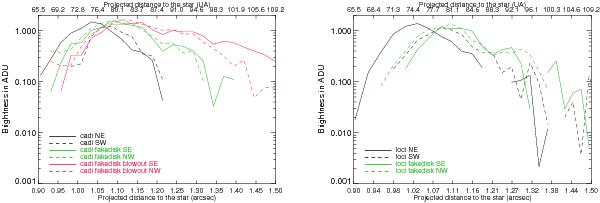
Left: simulated radial brightness distributions for the HR 4796ASD disk (green) and HR 4796ASBD disk with blowout (red) at L′ along the major axis (log scale) once inserted in the data cube and after cADI reduction has been applied. For comparison, observed SBD (black). Right: simulated radial brightness distributions for the HR 4796ASD disk (green) at L′ along the major axis (log scale) once inserted in the data cube and after LOCI reduction has been applied. For comparison, observed SBD (black).
Current usage metrics show cumulative count of Article Views (full-text article views including HTML views, PDF and ePub downloads, according to the available data) and Abstracts Views on Vision4Press platform.
Data correspond to usage on the plateform after 2015. The current usage metrics is available 48-96 hours after online publication and is updated daily on week days.
Initial download of the metrics may take a while.