Fig. 5
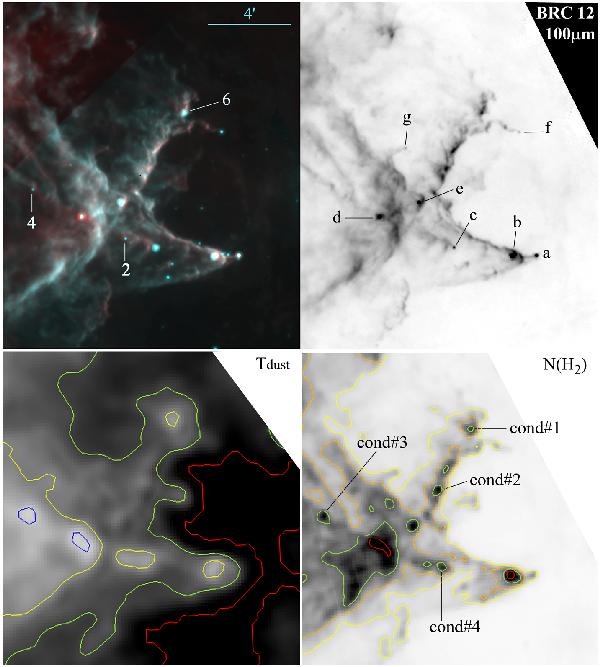
Field containing the bright-rimmed cloud BRC12. Top left: composite colour image: red is the Herschel-PACS emission at 100 μm and turquoise is the Spitzer-MIPS emission at 24 μm. Top right: the YSOs discussed in the text and present in Table 2 are identified. The underlying grey-scale image is the Herschel-PACS image at 100 μm. Bottom left: temperature map of the dust: the red contour is 26 K, the green is 24 K, the yellow is 22 K, and the dark blue is 20 K. Bottom right: column density map: the red contour is 4 × 1021 cm-2, the green is 2 × 1021 cm-2, the orange is 1 × 1021 cm-2, and the yellow is 0.5 × 1021 cm-2. The column density is high mostly in the direction of the point sources (it is the column density of their envelopes, smoothed by the beam). Some other condensations appear, which may be prestellar (see Sect. 6.6). North is up and east is left.
Current usage metrics show cumulative count of Article Views (full-text article views including HTML views, PDF and ePub downloads, according to the available data) and Abstracts Views on Vision4Press platform.
Data correspond to usage on the plateform after 2015. The current usage metrics is available 48-96 hours after online publication and is updated daily on week days.
Initial download of the metrics may take a while.