Table 1
Line parameters of the CH emission observed toward several cores.
| Source | Transition | T MB | ΔV | V LSR |

|
| (α2000,δ2000) | [K] | [km s-1] | [km s-1] | [K km s-1] | |
|
|
|||||
| TMC-1(CP) | F = 1−1 narrow | 0.536(12) | 0.26(1) | 5.916(3) | 0.787(3) |
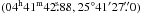
|
F = 1−1 broad | 0.429(8) | 1.28(2) | 6.123(8) | – |
| F = 0−1 narrow | 0.237(8) | 0.27(1) | 5.693(4) | 0.333(3) | |
| F = 0−1 broad | 0.181(5) | 1.29(3) | 5.892(13) | – | |
| TMC-1(NH3) | F = 1−1 | 0.445(22) | 1.40(8) | 5.97(3) | 0.665(22) |
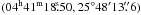
|
F = 0−1 | 0.205(21) | 1.44(17) | 5.81(7) | 0.349(21) |
| CI peak | F = 1−1 | 0.407(21) | 1.60(9) | 5.97(4) | 0.759(23) |
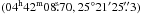
|
F = 0−1 | 0.193(20) | 1.46(18) | 5.85(8) | 0.305(22) |
| L1527 | F = 1−1 narrow | 0.333(58) | 0.22(5) | 6.26(2) | 0.607(22) |
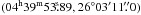
|
F = 1−1 broad | 0.310(30) | 1.57(14) | 6.34(5) | – |
| F = 0−1 narrow | 0.204(64) | 0.31(11) | 6.02(3) | 0.179(17) | |
| F = 0−1 broad | 0.089(57) | 1.13(46) | 6.12(16) | – | |
Notes. TMB, ΔV, and VLSR are obtained by a Gaussian fit. The error in the parentheses denotes one standard deviation in units of the last significant digits. The VLSR values refer to the rest frequencies given in Sect. 2, and the error of VLSR does not include the uncertainty of the rest frequency. A slight difference of the VLSR values between the F = 1−1 (main) and F = 0−1 (satellite) component likely originates from the error of the rest frequency of the F = 0−1 component. See text for details.
Current usage metrics show cumulative count of Article Views (full-text article views including HTML views, PDF and ePub downloads, according to the available data) and Abstracts Views on Vision4Press platform.
Data correspond to usage on the plateform after 2015. The current usage metrics is available 48-96 hours after online publication and is updated daily on week days.
Initial download of the metrics may take a while.