Fig. 5
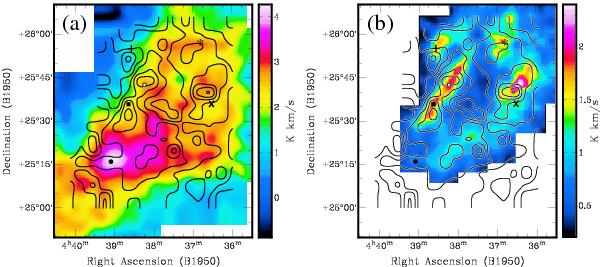
a) Contours show the integrated intensity map of CH overlaid on the color image of the [C I] ( : 492 GHz) distribution taken with the Mount Fuji Submillimter-Wave Telescope (Maezawa et al. 1999). The velocity range of the integration for the CH line is from 5.0 to 7.2 km s-1. The lowest contour and the contour interval is 0.1 K km s-1. b) Contours show the integrated intensity map of CH overlaid on the color image of the C18O (J = 1−0) distribution taken with the Nobeyama 45 m telescope (archival data). The velocity range of the integration of the C18O line is from 5.0 to 7.2 km s-1.
Current usage metrics show cumulative count of Article Views (full-text article views including HTML views, PDF and ePub downloads, according to the available data) and Abstracts Views on Vision4Press platform.
Data correspond to usage on the plateform after 2015. The current usage metrics is available 48-96 hours after online publication and is updated daily on week days.
Initial download of the metrics may take a while.