Fig. 4
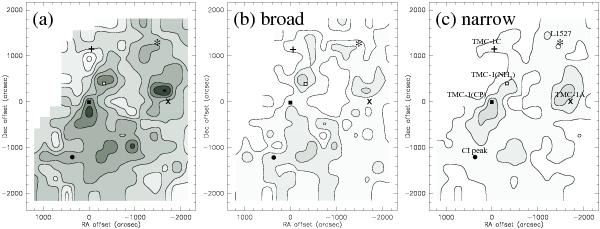
a) Integrated intensity map of the CH emission from 5.0 to 7.2 km s-1. Contours show every 0.1 K km s-1 from 0.1 K km s-1. b) Integrated intensity map of the broad component of the CH emission (4.7−5.8 and 6.6−7.2 km s-1). Contours show every 0.1 K km s-1 from 0.2 K km s-1. c) Integrated intensity map of the narrow component of the CH emission. Since the narrow component velocity slightly changes in a large scale, the 0.2 km s-1 span centered at the peak velocity is integrated to extract the narrow component. Hence, it should be noted that a part of the broad component is contaminated. Contours show every 0.05 K km s-1 from 0.1 K km s-1. Filled circle, filled square, open square, star, cross mark, and x symbols correspond to the position of the CI peak, TMC-1(CP), TMC-1(NH3), L1527, TMC-1C, and TMC-1A, respectively, as shown in c).
Current usage metrics show cumulative count of Article Views (full-text article views including HTML views, PDF and ePub downloads, according to the available data) and Abstracts Views on Vision4Press platform.
Data correspond to usage on the plateform after 2015. The current usage metrics is available 48-96 hours after online publication and is updated daily on week days.
Initial download of the metrics may take a while.