Fig. 1
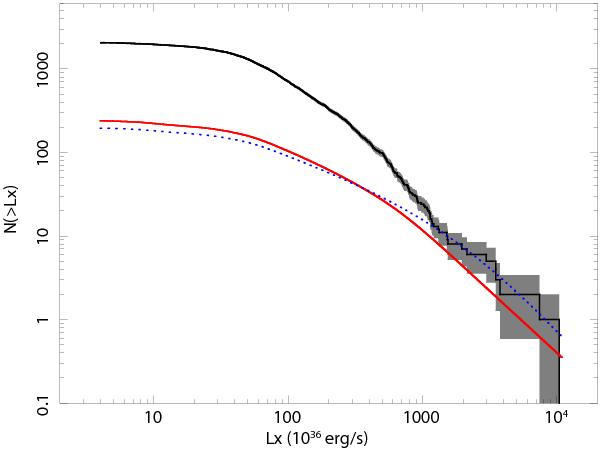
Observed cumulative distribution of all resolved point sources in all galaxies. The distribution is not corrected for incompleteness or the contribution of CXB sources. The shaded area shows 1σ Poissonian uncertainty. The thick solid and dotted lines show the predicted distribution of CXB sources based on the log (N) − log (S) from Georgakakis et al. (2008) and Moretti et al. (2003), respectively.
Current usage metrics show cumulative count of Article Views (full-text article views including HTML views, PDF and ePub downloads, according to the available data) and Abstracts Views on Vision4Press platform.
Data correspond to usage on the plateform after 2015. The current usage metrics is available 48-96 hours after online publication and is updated daily on week days.
Initial download of the metrics may take a while.