Fig. 8
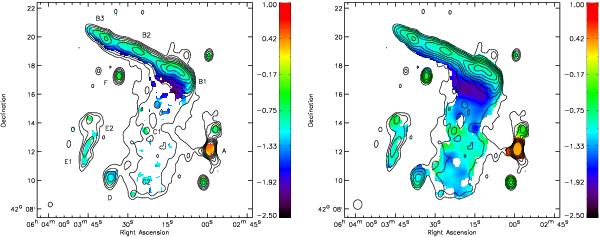
Left: fitted spectral index map between 2272 and 147 MHz. The spectral index map was made by fitting a second order polynomial in log (S) − log (ν) for each pixel in the maps at 2272, 1714, 1382, 1221, 610, 325, 241 and 147 MHz. Contour levels are drawn at [1,2,4,8,...] × 0.175 mJy beam-1 and are from the L-band image in Fig. 3. The spectral index map has a resolution of 20″ × 18″ and pixels below 1.5σrms were blanked. Right: fitted spectral index (2272 and 147 MHz) for each pixel in the maps at 2272, 1714, 1382, 1221, 610, 325, 241 and 147 MHz. The individual maps were convolved with Gaussians of 35″ FWHM and pixels with a spectral index error >0.7 were blanked, contours are drawn as in the left panel.
Current usage metrics show cumulative count of Article Views (full-text article views including HTML views, PDF and ePub downloads, according to the available data) and Abstracts Views on Vision4Press platform.
Data correspond to usage on the plateform after 2015. The current usage metrics is available 48-96 hours after online publication and is updated daily on week days.
Initial download of the metrics may take a while.