Fig. 3
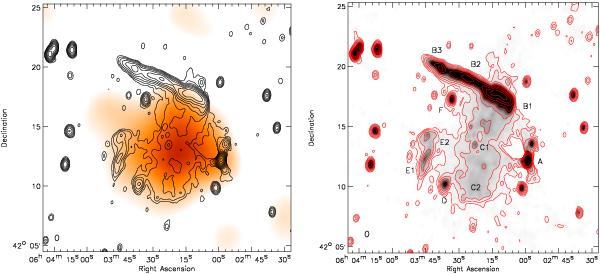
Left: X-ray emission from ROSAT. The image from the ROSAT All Sky Survey was smoothed with a 200′′ FWHM Gaussian and is shown in orange colors. Solid contours are from the WSRT L-band image and drawn at levels of [1,2,4,8,...] × 0.15 mJy beam-1. Right: WSRT L-band image (1160–1780 MHz) with sources labelled. Contour levels are drawn at [1,2,4,8,...] × 80 μJy beam-1. The beam size is 29″ × 19″ and indicated in the bottom left corner of the image.
Current usage metrics show cumulative count of Article Views (full-text article views including HTML views, PDF and ePub downloads, according to the available data) and Abstracts Views on Vision4Press platform.
Data correspond to usage on the plateform after 2015. The current usage metrics is available 48-96 hours after online publication and is updated daily on week days.
Initial download of the metrics may take a while.