Fig. 17
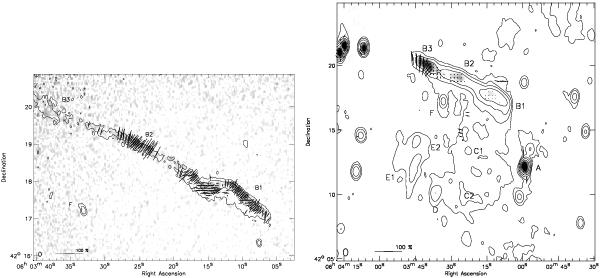
Left: WSRT 4.9 GHz polarization E-vector map. Total polarized intensity is shown as grayscale image. Vectors depict the polarization E-vectors, their length represents the polarization fraction. The length of the E-vectors are corrected for Ricean bias (Wardle & Kronberg 1974). A reference vector for a polarization fraction of 100% is shown in the bottom left corner. No vectors were drawn for pixels with a SNR < 3 in the total polarized intensity image. Contour levels are drawn at [1,4,16,64,...] × 3σrms and are from the Stokes I image. The beam size is 7.0″ × 4.7″ and indicated in the bottom left corner of the image. Right: WSRT 1382 MHz polarization E-vector map made with natural weighting. Total polarized intensity is shown as grayscale image. No vectors were drawn for pixels with a SNR <4 in the total polarized intensity image. Contour levels are drawn at [1,4,16,64,...] × 0.18 mJy beam-1. and are from the Stokes I image.
Current usage metrics show cumulative count of Article Views (full-text article views including HTML views, PDF and ePub downloads, according to the available data) and Abstracts Views on Vision4Press platform.
Data correspond to usage on the plateform after 2015. The current usage metrics is available 48-96 hours after online publication and is updated daily on week days.
Initial download of the metrics may take a while.